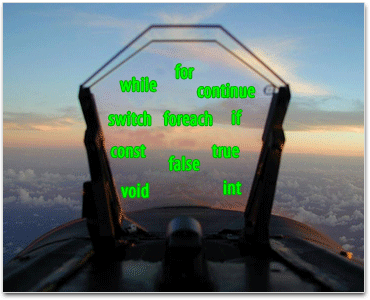
Statement Visualization is a new feature that we just introduced today. The key thought that led us when we were designing this feature is that debugging could be a lot easier if C# programmers had the same type of tool that air-force pilots benefit from – having a HUD display on top of the code editor as you step through code, showing you the most relevant information you need to solve the problem at hand.

See method return values, finally!
One of the most requested features of the Visual Studio debugger it for it to show the return value of a method before you step out of the method. People often end up rewriting their code to introduce a local variable so they can see that value in the debugger. With Statement Visualization, you’ll never have to do that again. You can see how the expression was evaluated right after you step over it, like this:
Another problem that people often wrestle with is the need to see the return values of method calls you just stepped over. Again, people frequently introduce locals in their code in order to debug effectively, but this can make code harder to read and unnecessarily complex. Plus, it’s just extra work that users have to do to please the debugger. Sometimes users copy/paste the method calls into the Watch or QuickWatch window, but then they often get foiled by the side effects of executing a method in the debugger. When methods are executed in the debugger the program’s state may be inadvertently changed, leading to a very confusing and frustrating debugging session.
With Statement Visualization, all these problems go away. As you can see in the above screenshot, Statement Visualization clearly shows what each of the calls to the GetLocation method returned.
LINQ Debugging gets easier
You can also use Statement Visualization to debug LINQ query comprehensions. For example, in the following scenario I put a breakpoint on the ‘where’ clause of the of the following query, so that I could see how it was evaluated for each item:
Each time the breakpoint is hit, we can step over the where clause and use Statement Visualization to see its result:
Unravel C# 3 Object Initializers
Another issue that used to be difficult is debugging C# 3′s Object Initializer syntax. The problem with stepping over statements that contain object initializers is that you often have a lot of things happening in the same statement. With Oz-Code, you can see see exactly what value each property being initialized received.
The following video shows how Statement Visualization handles multi-line statements, and how you can use keyboard shortcuts to control it:
Viewing Complex Objects in Statement Visualization
When the method you called returned a complex object, you can click the magnifying glass to view that object in the Quick Watch window:
Once you open the QuickWatch window, you can star the most important fields in that object. Stars and Statement Visualization work hand in hand so that you’ll get a more convenient display of the object without even needing to open the QuickWatch window. For example, after starring “FullName”, we’ll see:
Statement Visualization also works well with some of Oz-Code’s other features, accessible through the right click menu: you can take a snapshot of a method return’s value, and you cancompare it with other variables.
How does it all work and a word about performance
You might be wondering, “How does all this magic work?” Oz-Code’s Full Mode works by attaching a CLR Profiler to the debugee when it launches, much like Microsoft’s IntelliTrace feature. This allows us to trace the method parameters and the return value of any method you step over as you debug. The key difference between IntelliTrace and Oz-Code’s Full Mode is that Oz-Code only captures the most useful and relevant information to display to the user, thus minimizing the negative impact on the application’s performance.
One of our goals over the next few releases of Oz-Code’s Beta is to make the performance difference between Oz-Code “Standard Mode” (ie, Oz-Code as you know it today) and the new “Full Mode” as unnoticeable as possible. For now though, if you experience sluggish performance in Full Mode, please consider disabling the Foreach Visualization in the ...


